Vanderbilt is playing in two tournaments this week: One against the SEC, and one against predictive metrics — specifically the NCAA Evaluation Tool, or the NET.
There has been plenty of NET-related hate circling the Vanderbilt Twittersphere this week, and justifiably so. People should be frustrated with a system that values a 48-point win against a 13-20 team on a neutral site more than a win against No. 23 Kentucky on the road and a home win against Mississippi State (see Hofstra vs. William & Mary in the CAA Tournament). At this point, Vanderbilt’s failure to rise in NET or Kenpom rankings in spite of recent success is well publicized. Overall though, this year in college basketball invalidates the entire concept of predictive metrics to determine postseason qualification.
Simply put, the NET is broken. Look no further than the Ohio State Buckeyes to prove this assertion. Ohio State finished its regular season with a 13-18 record. It has a 2-12 Quad 1 record, a Quad 3 loss and a Quad 4 loss. It finished 13th in the Big Ten (second to last). Its NET rating? 63rd. Its Kenpom rating? 57th.
Vanderbilt (18-13, 11-7 in conference play) is tied for 4th in the SEC and has racked up four Quad 1 wins. Not to mention, the Commodores have won eight of their last nine games. Yet, it sits at 82nd (NET) and 81st (KenPom), respectively. This disparity ends the discussion. There is no logical argument that anyone can make for the Buckeyes being on the same level as the Commodores, let alone 20 spots higher. If the NCAA is going to use a data system as one of the main determinants of which schools earn bids to the 68-team field, that system cannot have outliers. It absolutely has to be reliable, without exception. Sure, there may be some variance that could lead to a 17-14 team in the hardest conference finding themselves a few spots higher than a 20-11 team in the easiest Power 5 conference. Still, the aforementioned scenario completely disqualifies NET as a capable system in determining the worthiness of an at-large bid. But, in the spirit of the perseverance of this season’s Vanderbilt Commodores, we shall not rest until we are no longer welcome to keep playing
How the NET works
When the NCAA moved away from the RPI system in 2018 as the main statistical tool used for evaluating potential tournament teams, it was completely understandable. RPI only used wins and losses in its algorithm, which disregards the nuance that exists in a team’s performance throughout a season. But RPI’s results-based system was crucially important. You would not find a team with a bad record severely out of place or a team with a good record equally disregarded unless it was an extreme scenario.
NET was the NCAA’s solution to RPI’s over-simplicity. Initially, you could argue that the model was actually quite good. Similar to RPI, it used results-based metrics like winning percentage and adjusted winning percentage. Neutral wins and losses are both equal to ±1.0. A home win equates to 0.6, a home loss -1.4 and vice versa for playing on the road. Three predictive barometers were included as well: Team Value Index, scoring margin and Net Efficiency, the latter of which is the difference between Offensive and Defensive Efficiency. Teams aim for a high Offensive Efficiency and a low Defensive Efficiency.
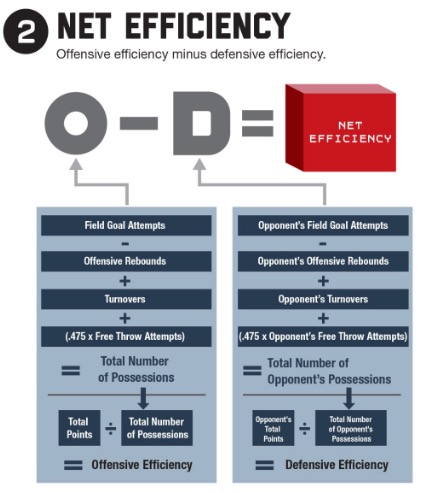
Okay. Now we have an algorithm that combines the results-based system from before, and introduces some predictive metrics that are pretty good at projecting success. A perfect balance between the two. Thanos would be proud. Well guess what? That lasted all of two seasons until 2020, when Winning Percentage, Adjusted Winning Percentage, and Scoring Margin were removed from the equation. The first two are more significant, considering scoring is still considered in Net Efficiency. After the changes to the NET in 2021, we were left with Net Efficiency and Team Value Index as the only two factors of NET, for which we do not even know how much weight is assigned to each.
How the NET applies to Vanderbilt
Okay, enough of the technical explanations of the NET. I know why you’re here: Why Vanderbilt is getting the raw end of the deal? Vanderbilt has an Offensive Efficiency of 104.4 points per 100 possessions (101st in DI men’s basketball), a Defensive Efficiency of 104.0 points per 100 possessions (259th in D1) and a Net Efficiency of +0.4 points per 100 possessions
If you are wondering why an 18-13 basketball team with an 11-7 conference record barely breaks even on one of the two most crucial stats in determining its NET, it is pretty simple. Vanderbilt lost in Tuscaloosa by 57 points. Stackhouse’s crew won 11 SEC games by a combined 69 points.
I understand that one game should not drastically impact a team’s Net Efficiency considering it is a 31-game season, but the disparity between Alabama and Vanderbilt’s efficiency was so drastic that, when you are splitting hairs between teams on the bubble, it becomes a big deal.
Herein lies the inherent problem with the new NET: Losing to arguably the best team in the country on the road, regardless of the score, should not hamper Vanderbilt so greatly that all of its 11 wins are almost canceled out.
Can you think of another team sport in which one game’s weight can be compared to that of 11? In football, soccer, baseball, hockey, lacrosse, curling, rugby and even professional basketball, there is no dynamic point value for winning and losing. While Vanderbilt is our focus here, the NET is a terrible idea overall. Can you imagine if Justin Herbert sprained his ankle in the first quarter of his Week Nine game, and the Los Angeles Chargers lost by 40 before he came back to win eight of the next nine games by a combined 32 points (in true Chargers fashion)? If the team finished with the fourth-best record in the AFC but missed the playoffs because it lost by 40 in a game he barely played, chaos would ensue.
And yes, of course, point differential matters. Good teams usually have good point differentials, and pretenders are often sold out by theirs. But it is wrong to use a system in which a 13-19 Ohio State team or a 16-15 Florida team (that Vandy beat twice and is 2-12 in Quad 1) are at least 20 points more favorably ranked than Vanderbilt.
The problem with the Team Value Index
Another reason why Vanderbilt is out of favor with the NET: the Team Value Index (TVI).
The TVI helped negate the issues of RPI for teams that played in difficult conferences that often cannibalized themselves. On the surface level, this structure makes sense: We all understand that the 6th best team in the Big 12 is better than the 2nd best team in the OVC. TVI fixes this disparity by accounting for game result, location and strength of opponent. Games are then broken down into a quadrant system, with Quad 1 being the strongest opponents and Quad 4 being the weakest.
While I previously advocated for college basketball to follow every other team sport, I’m now going to take the other side. Bear with me here. In all NCAA sports, it’s no secret that different teams play varying difficulties of schedules over the course of the season. One game is not enough to determine a team’s qualifications, but an entire season is. It makes sense in college basketball to quantify a team’s success in some way beyond just its record. If the NCAA is going to continue to let its sports be a jumbled mess of independently operating conferences, the playing field must be leveled for every team when evaluating who deserves to dance in March. This is why Quad 1 wins are so important. If a mid-major team wins 25 games in the regular season but is 0-2 in Quad 1, who did it really beat? Is the team better than a Power Five team that won 19 games but went 5-6 in Quad 1? Unless you are a Utah State fan, I think it is fair to say the answer is no.
Inversely, Quad 3 and Quad 4 losses are damaging to a team’s TVI. Again, no arguments here.
But the balance between Quad 1 wins and Quad 3 and 4 losses appears to be off. Vanderbilt is seemingly being held back from progressing in NET due to three losses: a Quad 3 loss to Southern Mississippi, a Quad 3 loss to LSU and a Quad 4 loss to Grambling State. I am not here to say these losses are not bad losses and do not matter. But why do they matter so much in this NET system? Here are a few NET resumes that inspired this question:
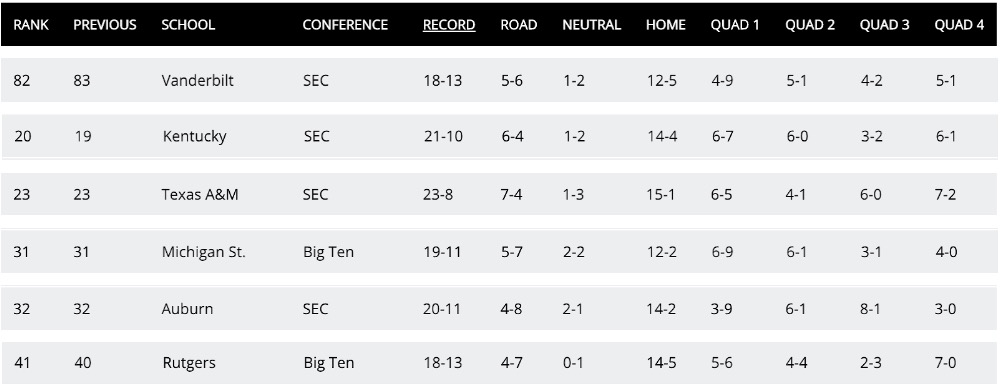
When looking at quad records, Vanderbilt’s is not as impressive as Kentucky’s and Texas A&M’s. It is most certainly not 60 spots worse, however.
The Commodores have slightly worse resumes than Auburn and Michigan State, both of whom are firmly in the tournament.
Rutgers can be found in the Last Four In section of many bracketologists’ lists, and no further than the first four out. The Scarlet Knights have lost six of their last eight.
While the TVI makes sense on paper in terms of evening the playing field between disproportionate scheduling, it is flawed and unbalanced in reality. For instance, even after three Quad 1 wins and three Quad 2 wins in their recent hot streak, Vanderbilt has gone from 93rd to 82nd in NET since Jan. 30. Iowa State beat Baylor on the road on March 4 and climbed nine spots in one night. Truthfully, I cannot explain this disparity.
The good ‘ol eye test
Most of this article has been spent breaking down data. Ironically, heavy reliance on data is a major issue in college basketball. Why have a selection committee if the NET is so heavily advertised as the primary factor in a team’s tournament resume? College football similarly uses a committee for postseason selection, but there is no signature algorithm promoted as a realistic representation of where each team stands.
The committee claims that the NET is just one factor in finalizing which teams get into the tournament. Fans are told the eye test still matters, and the way teams are playing down the stretch is important.
Vanderbilt has unequivocally passed the eye test of late. After a 3-6 conference start, the Commodores resembled a bull in a china shop after the Alabama loss, running through the conference to finish 11-7. The SEC coaches recognized this prowess, recently naming Jerry Stackhouse SEC Co-Coach of the Year. Liam Robbins was playing some of the best basketball in the country, and Jordan Wright has quickly picked up the slack when Robbins was ruled out for the season. If you started watching Vanderbilt Men’s Basketball in February, you would send Vanderbilt to the tournament without a second thought, so the “‘Dores are hot” criteria is covered.
Even Vanderbilt’s non-conference losses appear less detrimental through the eye test. Every one of these losses either came to a conference champion or a cemented tournament team. If the committee truly does consider all relevant information, it should see these losses and understand that NET is not giving Vanderbilt enough credit for what it has done this year.
The SEC is currently projected to have seven or eight teams in the tournament, per ESPN’s Joe Lunardi. Unless Vanderbilt loses its first game in the SEC tournament in Nashville this weekend, the Commodores should be one of those teams. At the moment, it appears that the committee may give an at-large bid to 10th-place Arkansas (19-12 overall) and to 9th-place Mississippi State (20-11 overall) over the Commodores. Vanderbilt finished tied for 4th place in the SEC and beat both of these teams the only times they played, and, along with Texas A&M, has won the most games in the SEC since February 1st.
If the Commodores are not invited to their first NCAA Tournament since 2017 this year, the selection committee may as well just have the computers decide the field anyway.


