Vanderbilt releases results from 2019 sexual assault, misconduct survey
The survey generated data regarding prevalence and circumstances of sexual assault and harassment, student responses, bystander behavior, student perceptions and student knowledge of resources
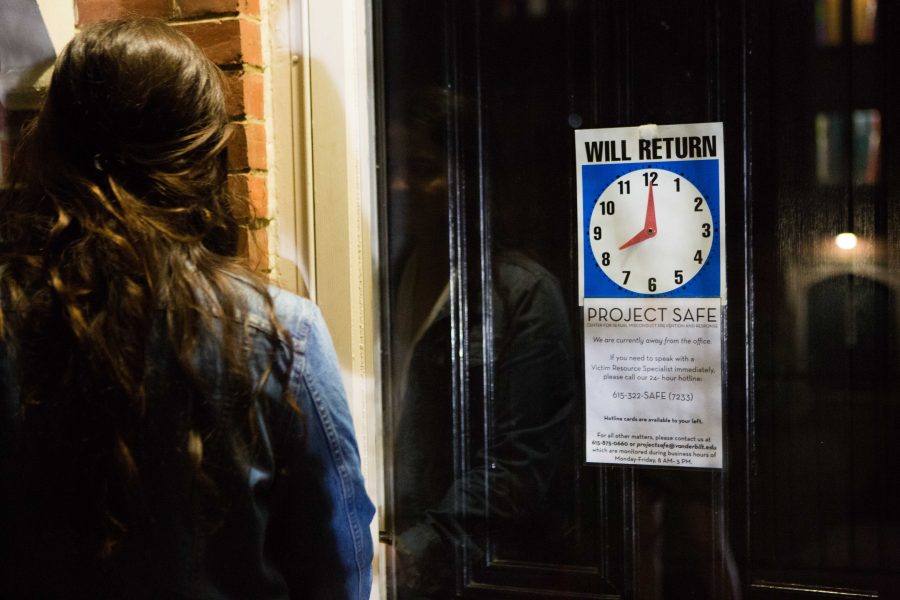
Project Safe helps direct and heal survivors of sexual assault
The Dean of Students office released the results from the Student Campus Climate Survey on Sexual Assault and Misconduct Oct. 15. The survey was conducted in partnership with the Association of American Universities. The university also released the results from the Sexual Harassment Survey of Faculty and Post-Doctoral fellows.
“The survey results show a highly engaged and informed campus community, united in its response around the need to address persistent issues of sexual assault and misconduct on campus,” Dean of Students Mark Bandas said in an email to Vanderbilt students. “While the survey results show that our campus is informed and engaged on these issues, there is still much work we must do together as a community to address them.”
Slightly more than 4,000 undergraduate, graduate and professional students responded, or 32.9 percent of campus. Third party social services firm Westat designed and administered the survey in partnership with the AAU, which aggregated the reports Vanderbilt released. Vanderbilt is one of 33 higher education institutions to have administered the survey in Spring 2019.
The survey provided data in a variety of categories: prevalence and circumstances, student responses, bystander behavior, student perceptions and student knowledge of resources.
Respondent data
The respondent rate showed that 38.7 percent of women filled out the survey compared to 25.9 percent of men. 34 percent of Trans, Genderqueer, Questioning, Non-binary/not identified (TGQN) students filled it out. Specifically,1,442 undergrad women filled it out compared to 765 undergrad men.
Rates of nonconsensual incidents
The Vanderbilt undergraduate data on “nonconsensual sexual contact by physical force or inability to consent or stop what was happening” closely mirrors the average of all AAU surveys: 26.9 percent of Vanderbilt female undergraduates reported this occurrence since enrolling, compared to 25.9 percent on average from all AAU surveys. 7.8 percent of undergraduate Vanderbilt men responded affirmatively, compared to 6.8 percent of all AAU survey respondents.
The data, which is available to members of the Vanderbilt community with VUnet login credentials, also broke down incidents of sexual misconduct by demographics and looked into characteristics of offenders and the nature of the offenses.
Harassing behaviors
The survey also recorded data on harassing behaviors, which is defined to include sexual jokes or stories that were insulting or offensive; inappropriate comments about someone’s appearance or sexual activities; crude or gross sexual things or unwanted sexual conversation; or continued to ask you out when you’d said no. 64.9 percent of female undergraduate students and 47.2 percent of undergraduate men responded to having experienced this kind of action. On both undergraduate and graduate/professional levels, 62.8 percent of Vanderbilt TGQN students responded affirmatively to experiencing harassing behaviors.
Perceptions and attitudes toward sexual assault, campus responsiveness
In regard to student perceptions, the survey’s executive summary reports, “Approximately 1/3 of Vanderbilt students see sexual assault and misconduct as “very” or “extremely” problematic on campus. This is higher than the rates of concern for the AAU survey institutions as a whole. Fewer than 10% of students see it as not a problem at all, with male graduate / professional students being more likely to see it as not a problem than female, undergraduate, or TGQN students.”
Vanderbilt also conducted a climate survey on sexual assault attitudes and pervasiveness in 2015. However, the 2019 survey did not use the same language, definitions or metrics in all cases, making comparisons over time difficult.

Rachel Friedman was a student in the College of Arts & Science who studied history and mathematics. Before serving as Editor in Chief, Rachel was the Campus Editor of The Hustler. You can reach her at [email protected].

Sam Zern ('20) has been a member of The Vanderbilt Hustler since her freshman year, first as a staff writer and shortly after as assistant campus editor. She went on to be campus editor and, later, editor in chief. In her senior year at Vanderbilt, Sam was managing editor and streamlined recruitment and training processes.
In her time as a member of the editorial board, she has prioritized diversity and breadth in coverage, wanting to make sure as much of Vanderbilt as possible is represented in...